Bitcoin's $87K trend line: why CryptoQuant is watching it
CryptoQuant says bitcoin is testing its 20-month average near $87,165, a level that preceded new highs before. What the signal says and what it does not.
CryptoGroup Newsroom · · 2 min read
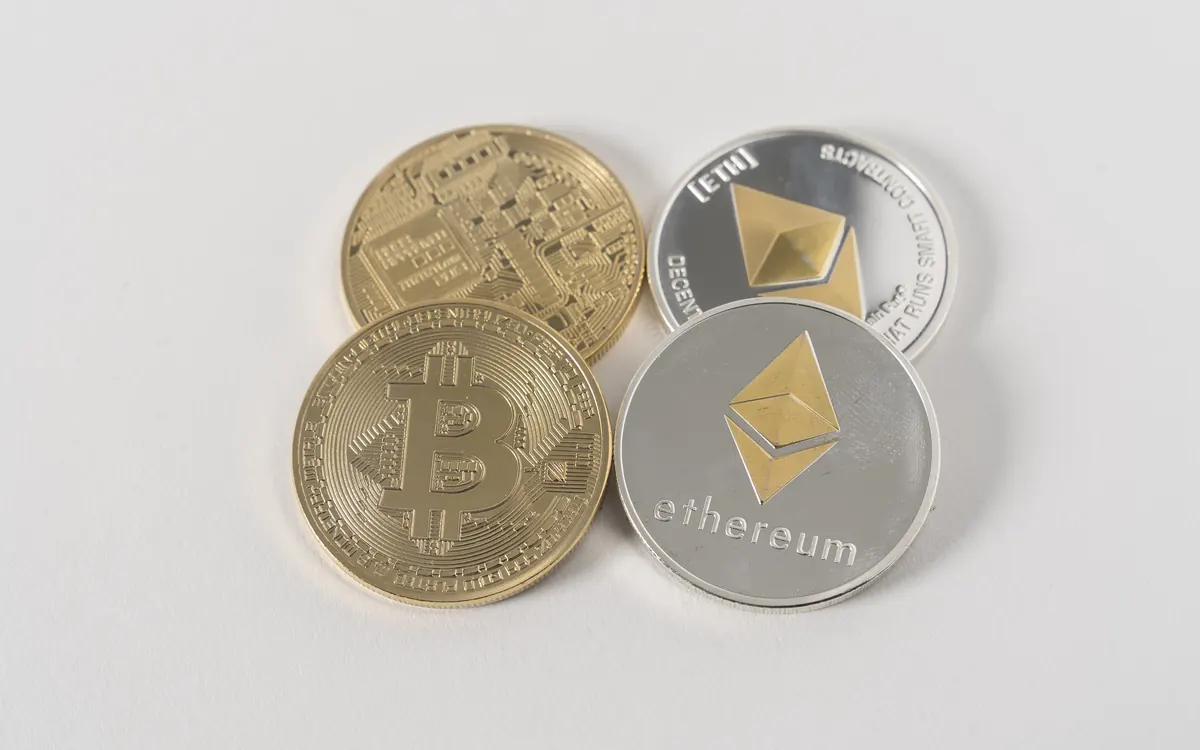
Just over a year after the all-time high, the market has concluded its ‘reset’.
On this page
On-chain analytics firm CryptoQuant says bitcoin has begun a new fight with its 20-month simple moving average, which stood at about $87,165 on Oct. 16, and that past breaks above this line have led to fresh cycle highs, Cointelegraph reports. BTC was trading in the low $80,000s, just after a brief dip below $80,000 this week.
The signal in brief
- The 20-month SMA is the centre line of the Bollinger Bands that CryptoQuant uses in its Market Cycle Signals tool. The bands currently sit around $121,640 (upper) and $52,694 (lower).
- The zone between the lower band and the SMA is labelled an "accumulation base." The SMA itself is the "inflection frontier", where holders capitulated as price fell through it from above, most recently in December 2025.
- Contributor GugaOnChain argues the market's "reset" is complete and that retail traders worried about the $82,442 area are misreading it.
- The SMA lines up with bitcoin's 2026 opening price of about $87,490, and Cointelegraph notes large sell orders stacked near that zone on exchange order books.
Our take
The level is worth watching for a simple reason: two widely followed reference points — the long-term average and the year's opening price — sit within a few hundred dollars of each other, and visible sell walls cluster there. If BTC closes months above it, the "reset is over" camp gains a strong talking point; repeated rejections would make the same line look like a ceiling.
But a monthly moving average is a slow, backward-looking tool. Bollinger Bands describe volatility, not direction, and they are not designed to issue buy or sell signals — a caveat the indicator's own framing acknowledges. Two cycles of history is also a thin sample, and this year's moves have been driven heavily by macro data such as the hot US PPI print that pushed BTC below $80,000.
CryptoQuant's wider stance is upbeat: CEO Ki Young Ju declared the bear market "over" in late August, and its bull-bear indicator has risen to 0.186 from 0.042 in August. Treat that as one data-driven opinion among many, not a forecast. If you are new to the market, start with our guide on how to buy bitcoin and size any exposure to what you can afford to lose.
This article is for information only and is not financial advice. Crypto assets are volatile; do your own research. Read our disclaimer
More from Markets
View all →Read next

Ether margin longs on Bitfinex climb as prices stall
Bitfinex traders hold about 367,500 ETH in margin longs against under 9,000 ETH in shorts, while bitcoin and ether trade flat into a quiet Saturday evening.

Fidelity's Solana health check: reliable, but too concentrated
Fidelity's FCAT says Solana has gone two years without a major outage, yet 18 validators, one host and two EU cities hold an outsized share of its stake.

Vitalik: bitcoin mining runs on power, AI on hardware
Vitalik Buterin's cost tables show bitcoin mining split about 50/50 between hardware and electricity, while AI inference spends roughly 76% on hardware.